Is the Valuation Profession Missing Its “IFAC Moment”? April 20, 2026
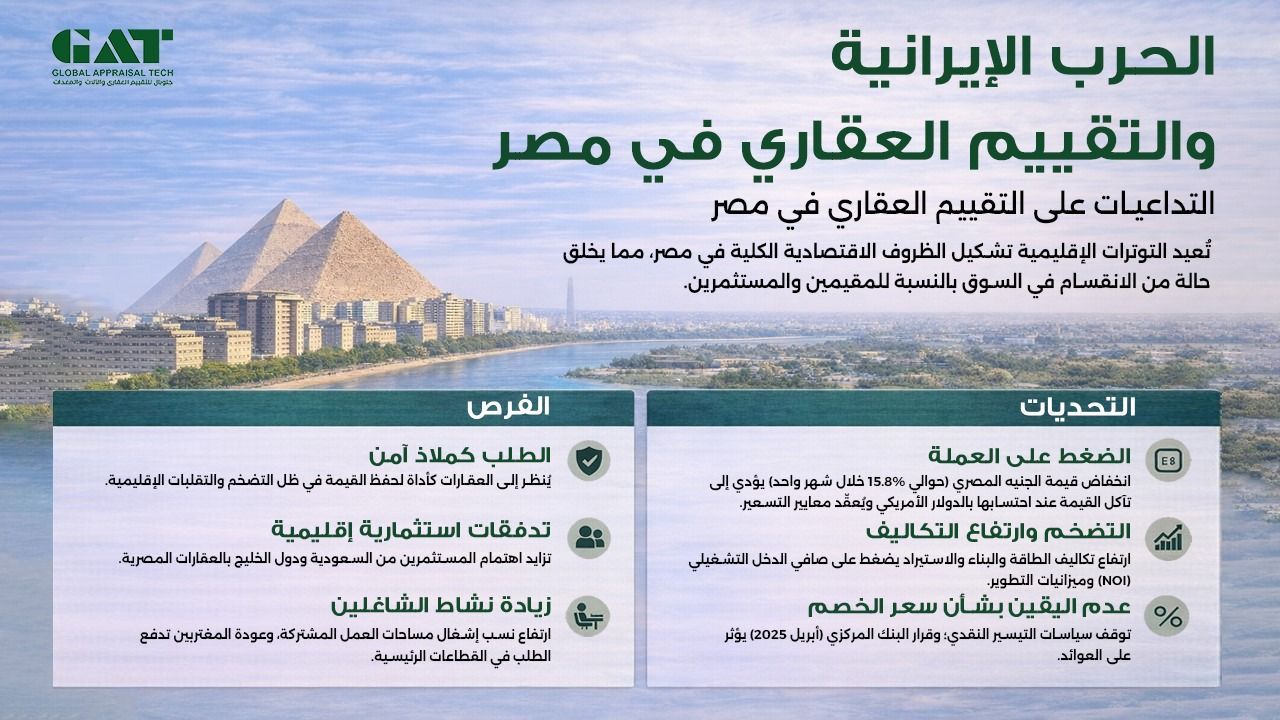
عندما تتداخل الحرب الإيرانية مع التقييم: المنظور المصري أبريل 2026
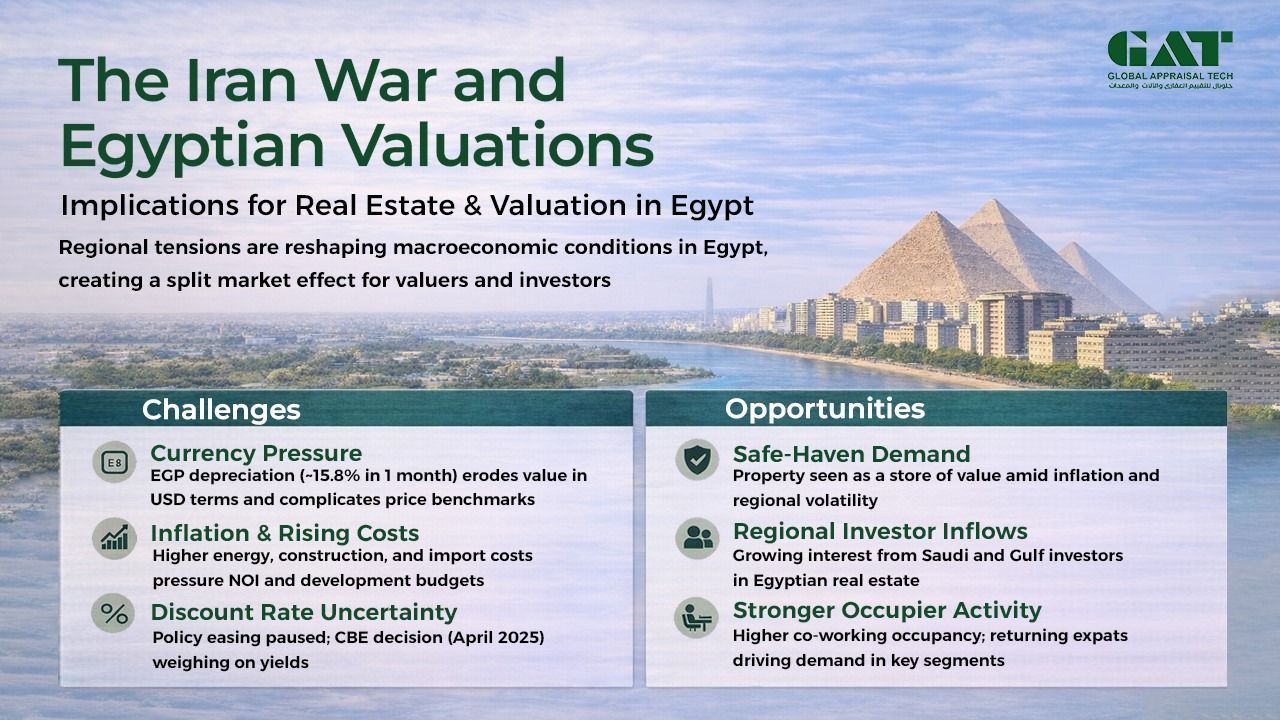
When War Enters the Valuation Model: The Egypt Perspective April 1, 2026
جلوبال أبرايزال تك تشارك في تقييم استحواذات فندقية استراتيجية لمجموعة طلعت مصطفى 6 أبريل 2025 – 16 أكتوبر 2025

بجلوبال أبريزال تك تُنجز تقييمًا استراتيجيًا لأحد أكبر مجمعات الصناعات الغذائية في الشرق الأوسط تمهيدًا لتوسعة كبرى في سايلو فودز 29 نوفمبر 12 – 2022 يناير 2023
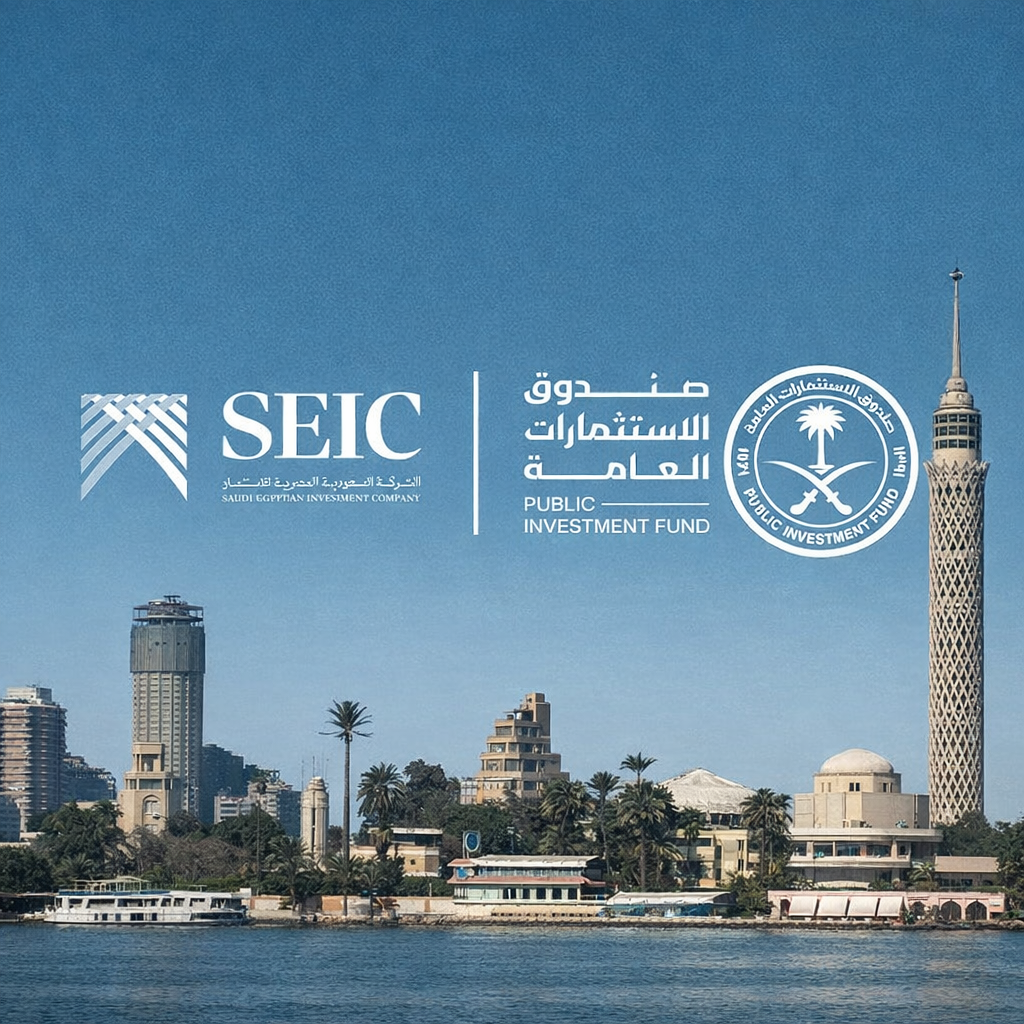
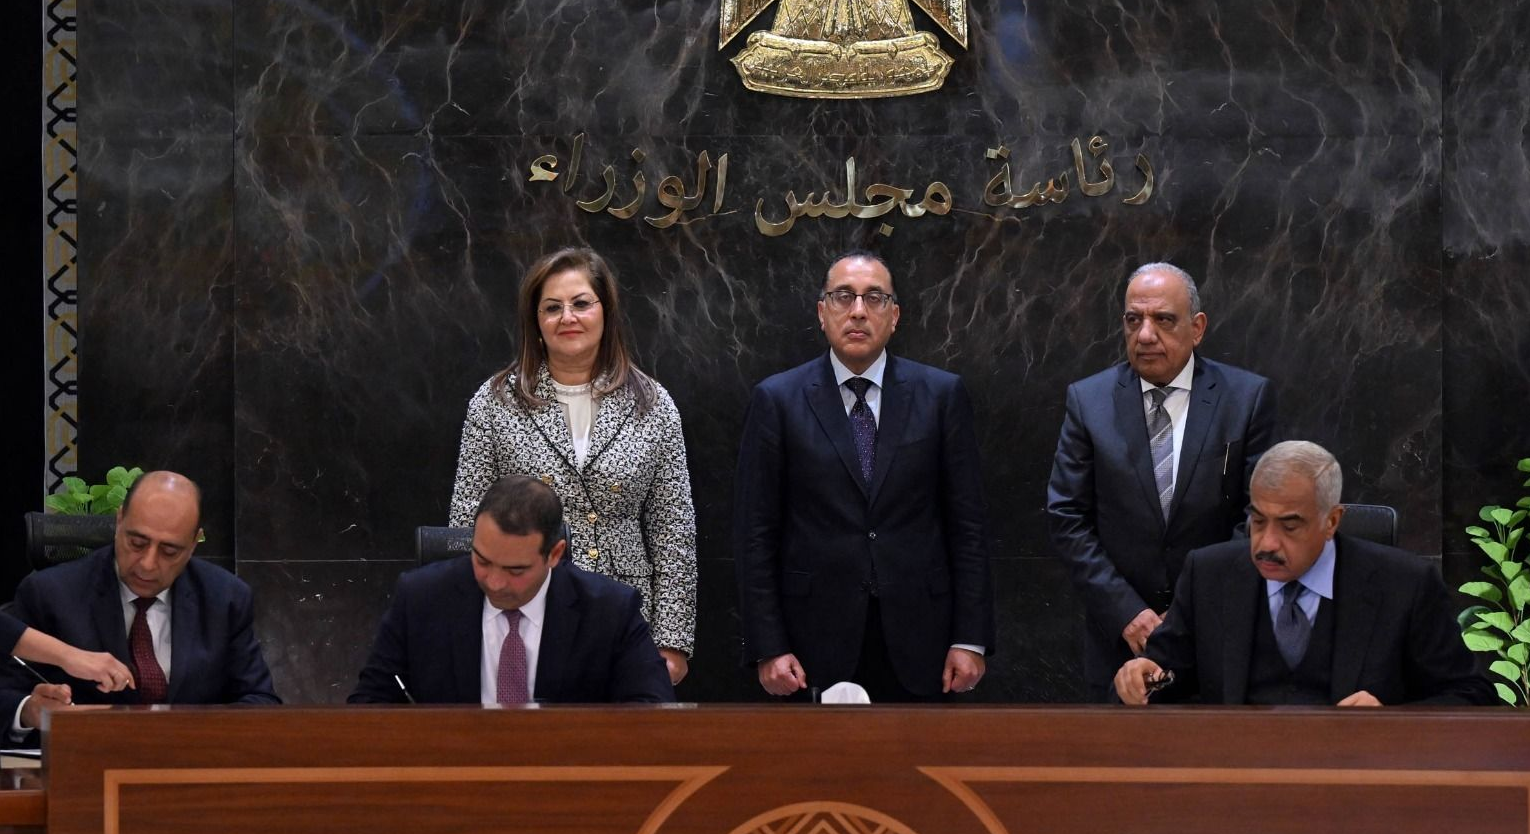
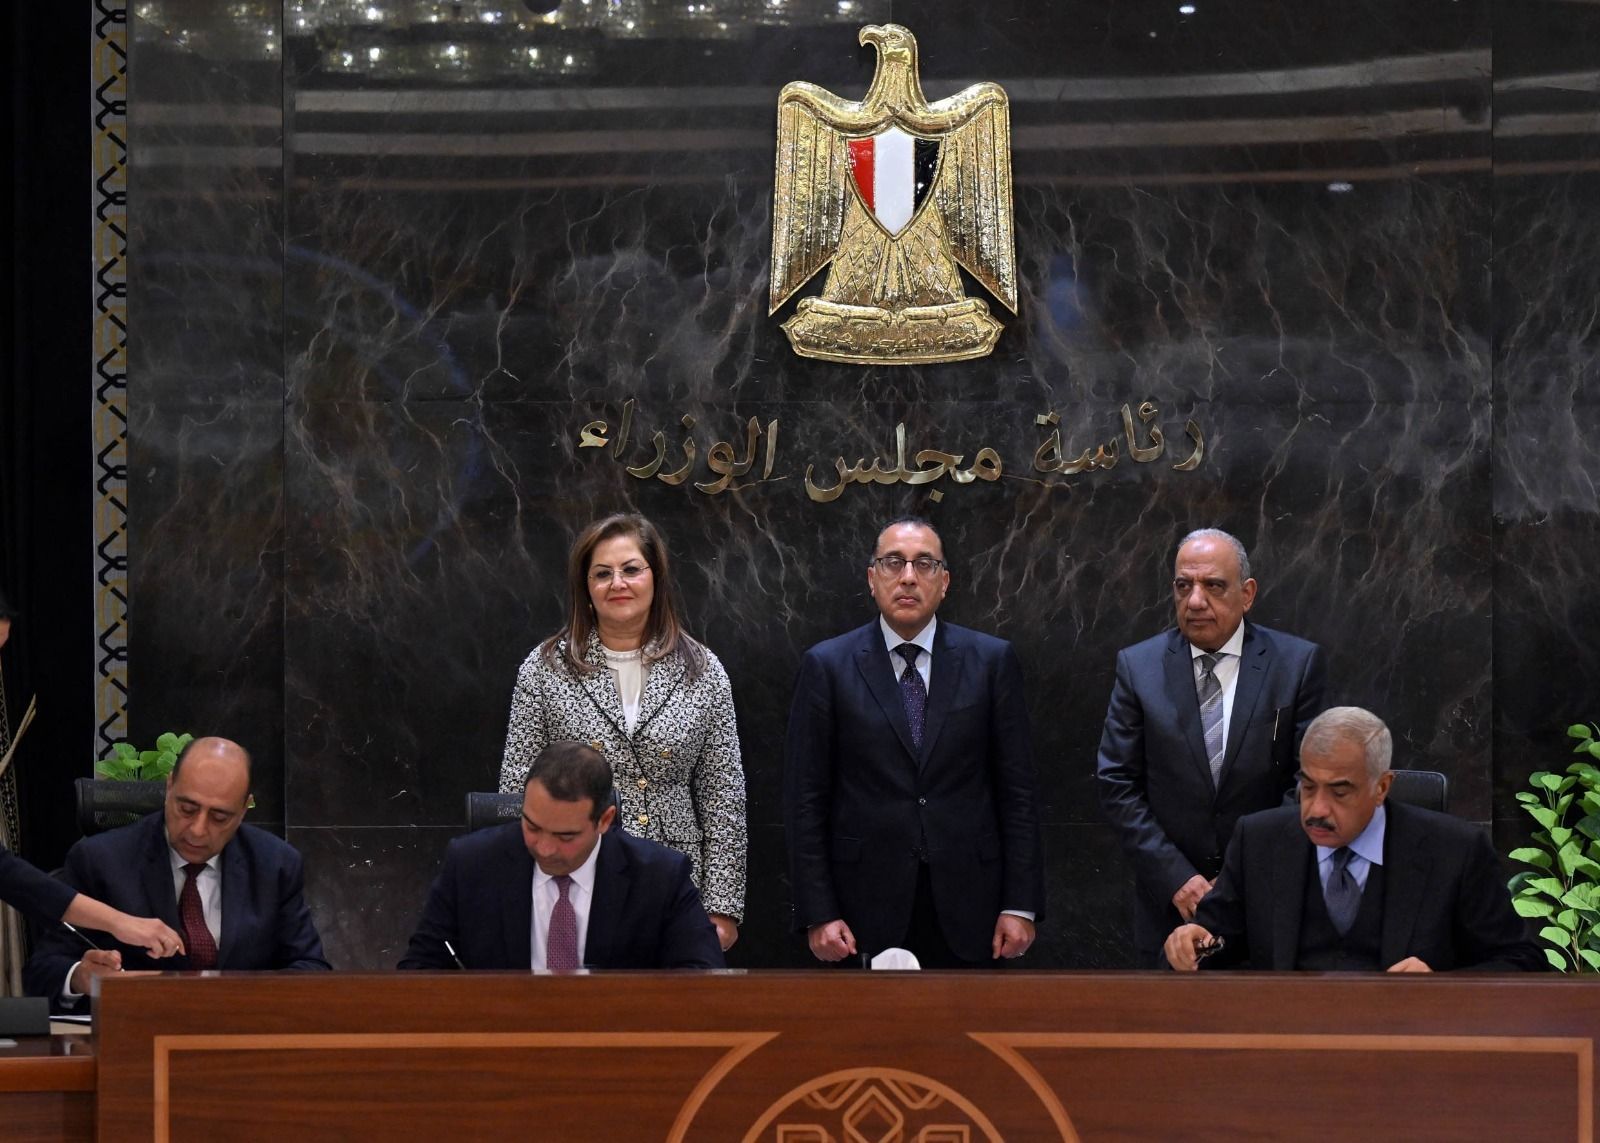
بمشاركة جلوبال أبرايزال تك في تقييم أصول الاستحواذ، وقّعت «الشركة السعودية المصرية للاستثمار» التابعة لصندوق الاستثمارات العامة اتفاقية ملزمة للاستحواذ على حصص أقلية في أربع شركات مصرية. 17 سبتمبر 2024 – 24 ديسمبر 2024

From Technical Verification to Strategic Advisory: GAT’s Role in Ras El Hekma’s Landmark Launch North Coast, Egypt – [Feb. 2024]
من الفحص الفني إلى الاستشارات الاستراتيجية : دور جلوبال ابريزال تك في إطلاق مشروع رأس الحكمة
With the participation of Global Appraisal Tech (GAT) in the valuation of the acquisition assets, the Saudi Egyptian Investment Company (SEIC), an affiliate of the Public Investment Fund (PIF), signed a binding agreement to acquire minority stakes in four Egyptian companies. September 17, 2024 – December 24, 2024
Global Appraisal Tech (GAT) Plays a Key Role in the Valuation of Seven Landmark Hotels within Talaat Moustafa Group’s Strategic Acquisition April 6, 2025 – October 16, 2025